
Widget
Stats overview widgets
简介
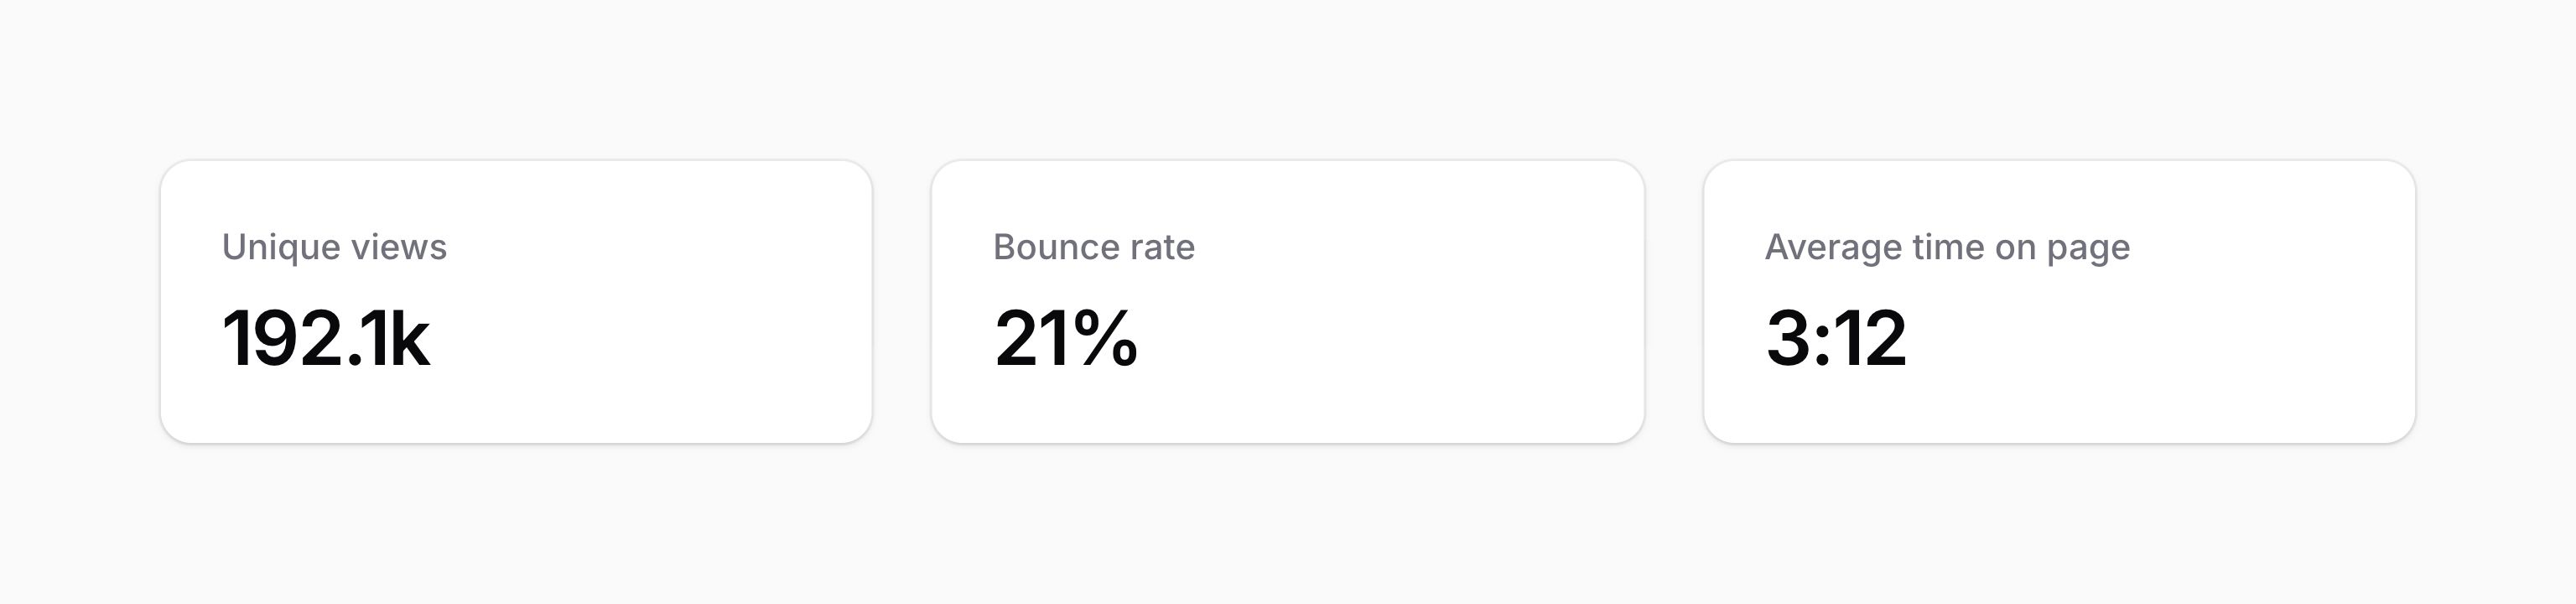
Filament 自带一个 “统计概览” Widget 模板,用来在单个 Widget 中展示许多不同状态,而无需编写自定义视图。
使用以下命令创建 Widget:
php artisan make:filament-widget StatsOverview --stats-overview
该命令将会创建一个新的 StatsOverview.php 文件。打开该文件,然后在 getStats() 方法中返回 Stat 实例:
<?php

namespace App\Filament\Widgets;

use Filament\Widgets\StatsOverviewWidget as BaseWidget;
use Filament\Widgets\StatsOverviewWidget\Stat;

class StatsOverview extends BaseWidget
{
    protected function getStats(): array
    {
        return [
            Stat::make('Unique views', '192.1k'),
            Stat::make('Bounce rate', '21%'),
            Stat::make('Average time on page', '3:12'),
        ];
    }
}
现在,你可以到仪表盘上去查看 Widget 了。

添加描述及图标
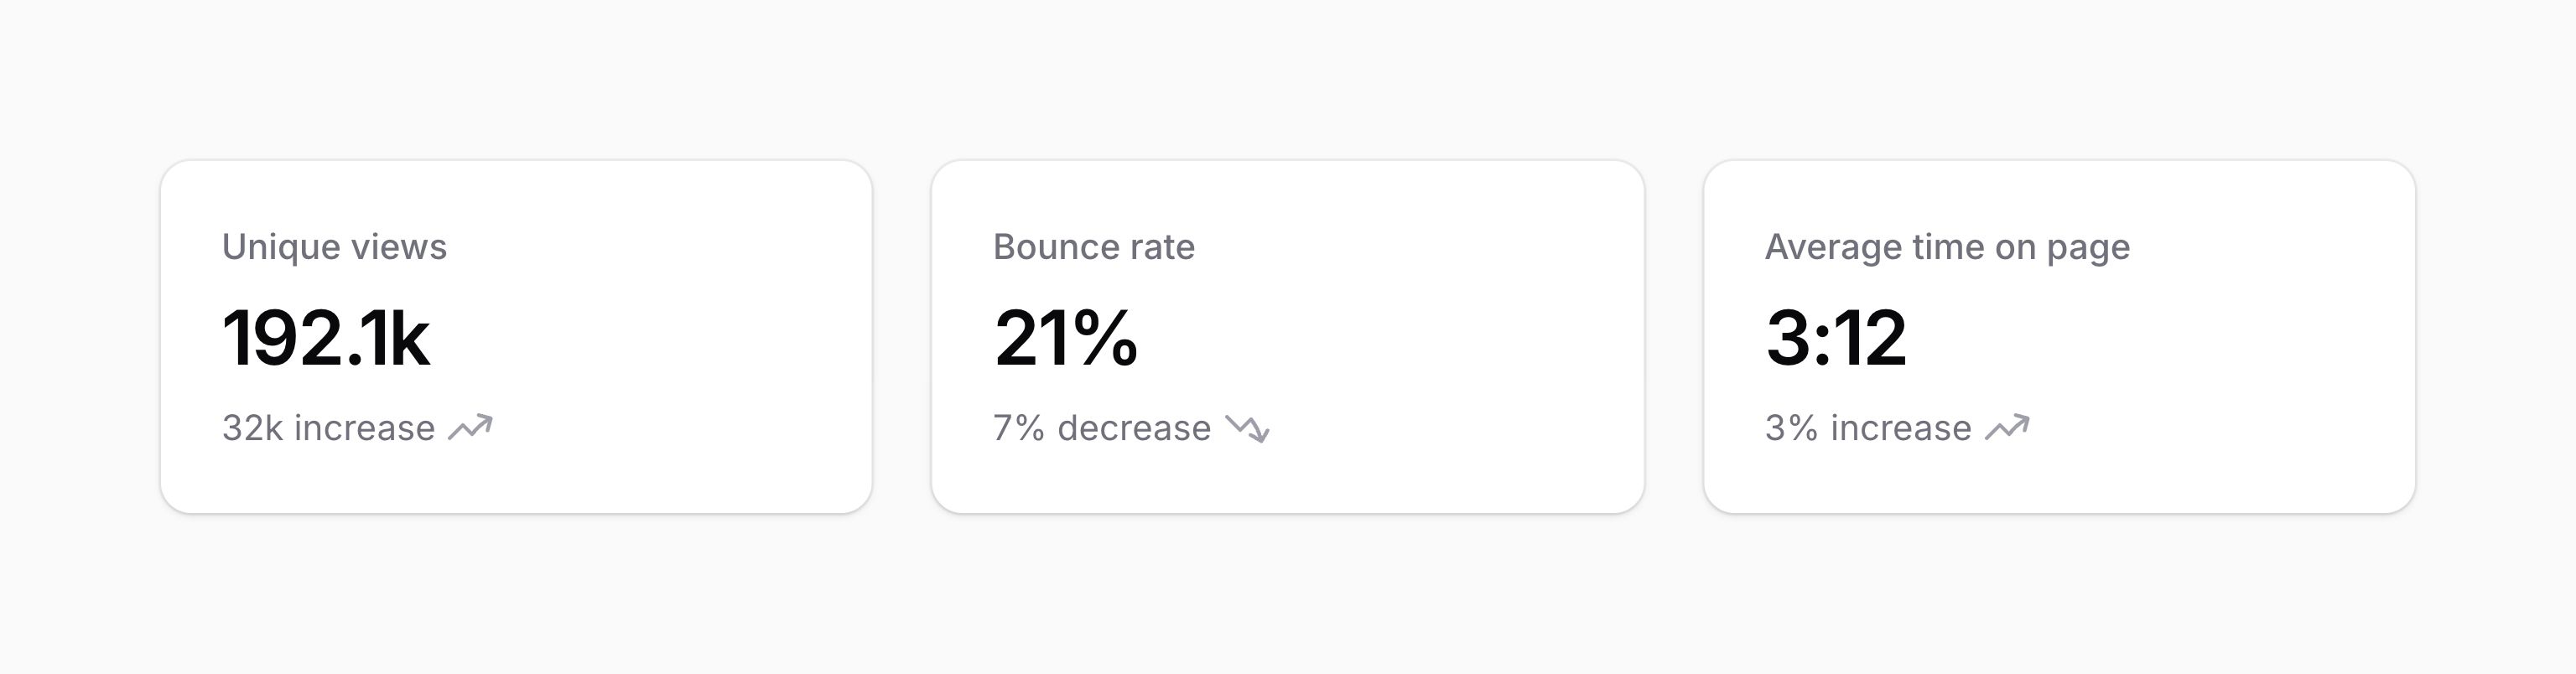
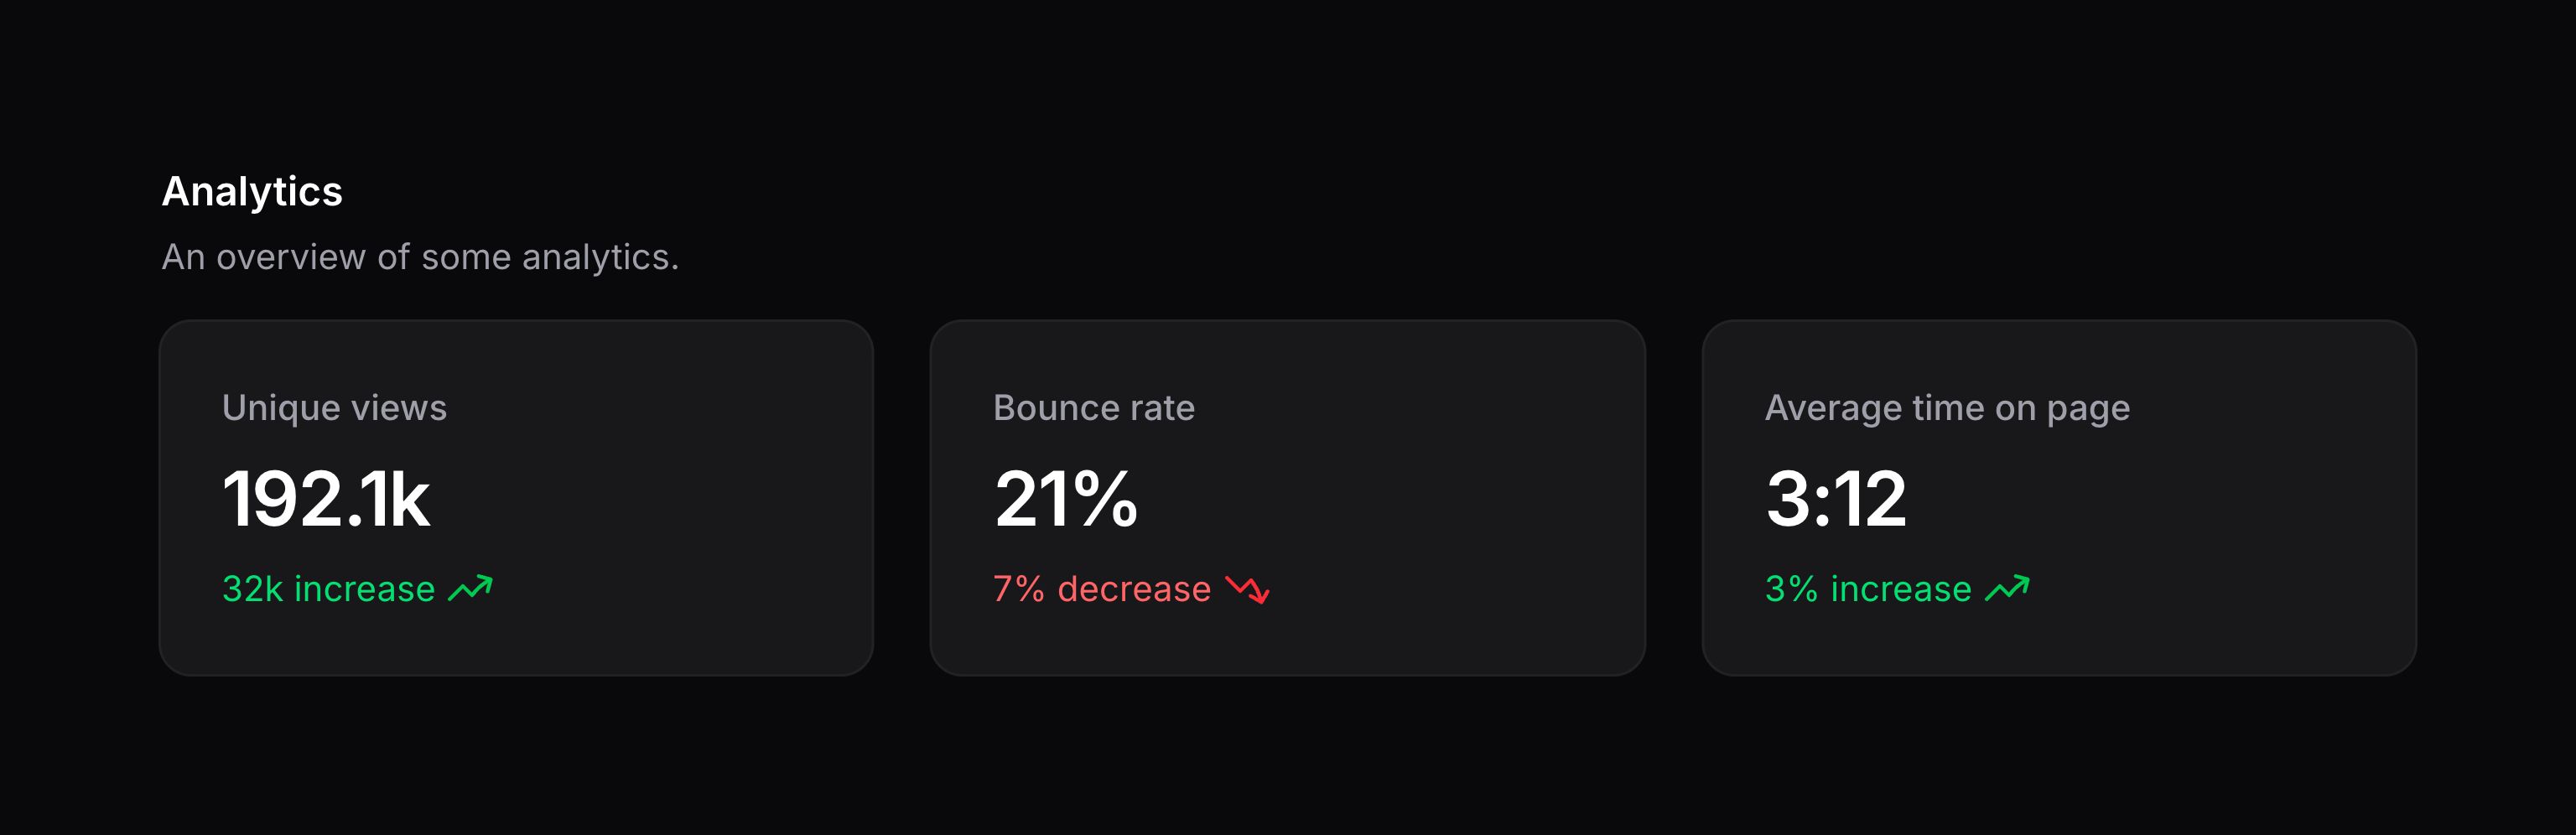
你可以使用 description() 方法提供额外的描述信息,同时也可以通过 descriptionIcon() 添加描述图标:
use Filament\Widgets\StatsOverviewWidget\Stat;

protected function getStats(): array
{
    return [
        Stat::make('Unique views', '192.1k')
            ->description('32k increase')
            ->descriptionIcon('heroicon-m-arrow-trending-up'),
        Stat::make('Bounce rate', '21%')
            ->description('7% decrease')
            ->descriptionIcon('heroicon-m-arrow-trending-down'),
        Stat::make('Average time on page', '3:12')
            ->description('3% increase')
            ->descriptionIcon('heroicon-m-arrow-trending-up'),
    ];
}
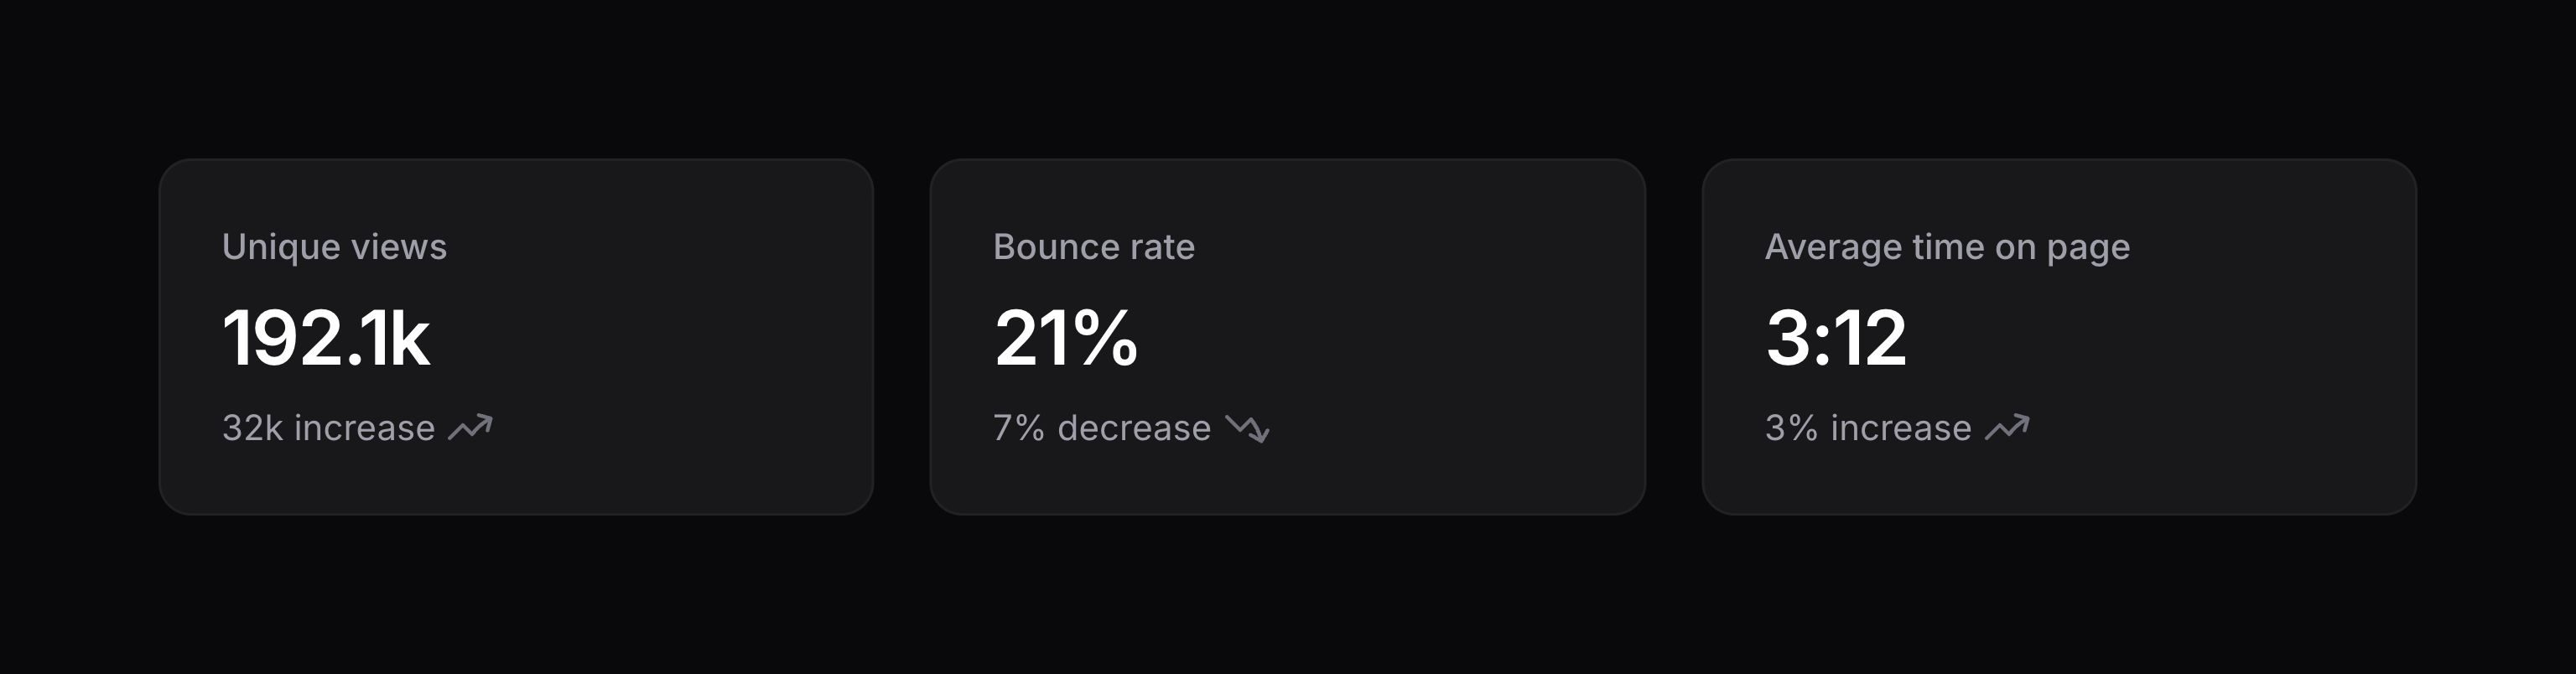
descriptionIcon() 方法也接收第二个参数,以将图标放到描述之前而非之后:
use Filament\Support\Enums\IconPosition;
use Filament\Widgets\StatsOverviewWidget\Stat;

Stat::make('Unique views', '192.1k')
    ->description('32k increase')
    ->descriptionIcon('heroicon-m-arrow-trending-up', IconPosition::Before)
修改 Stat 颜色
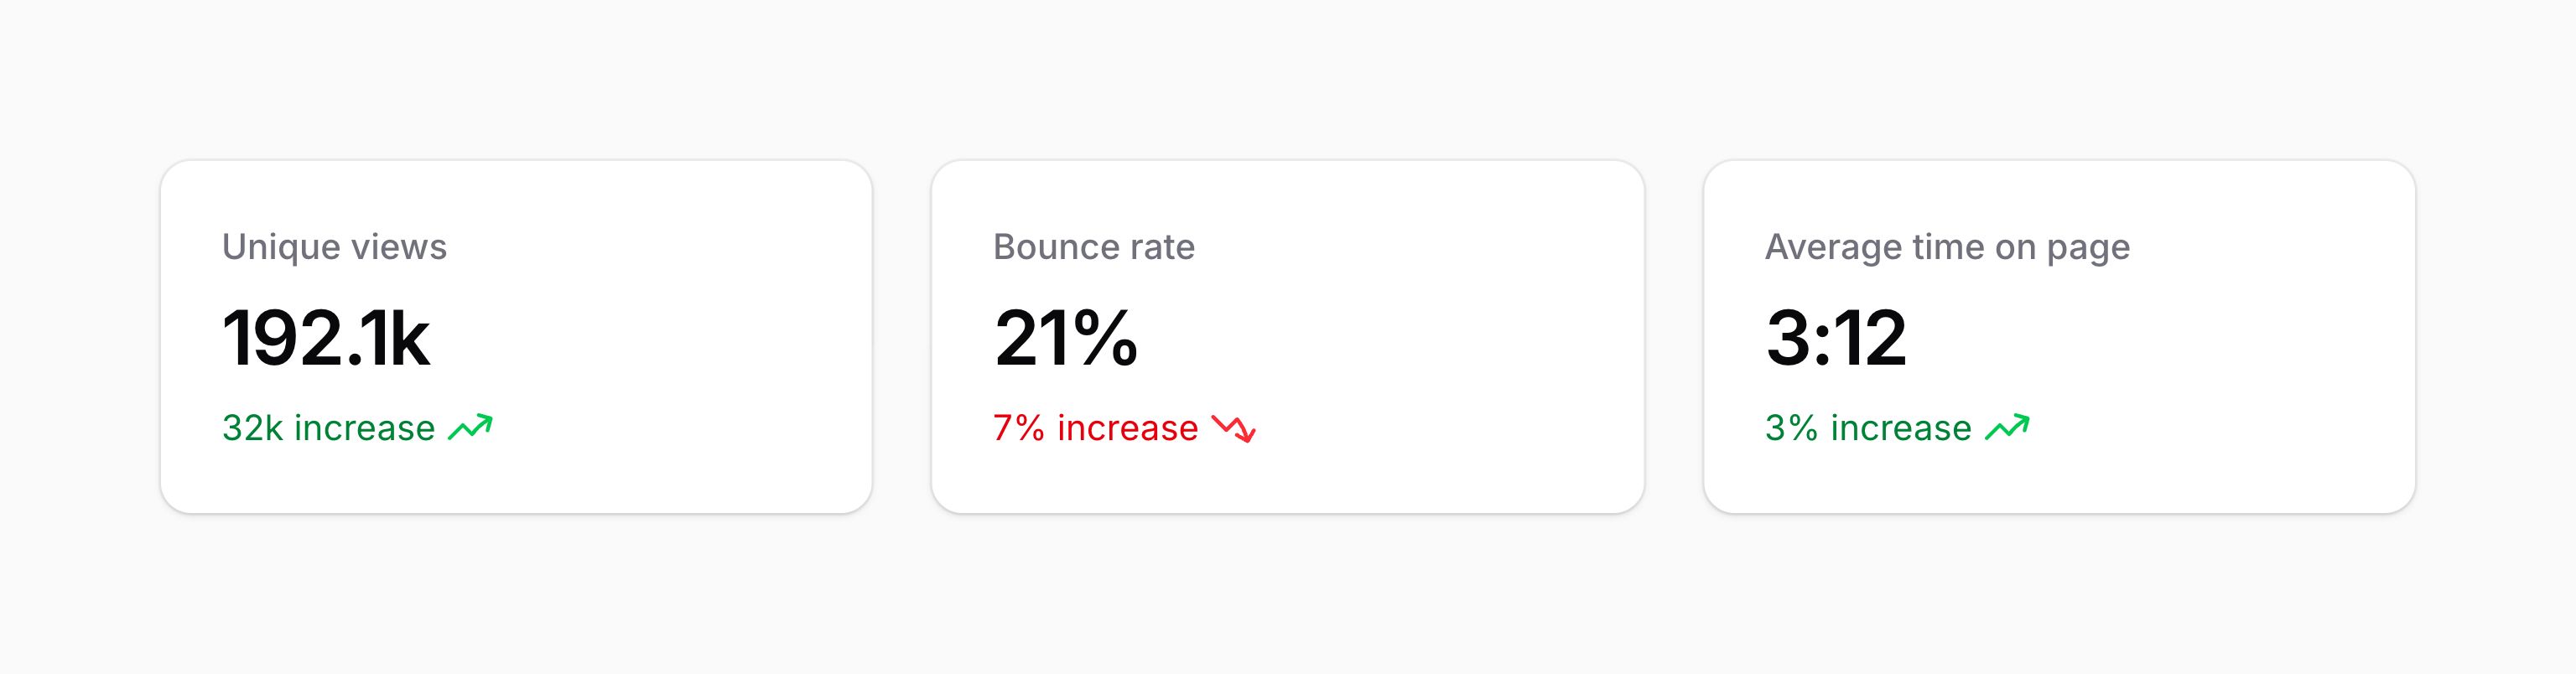
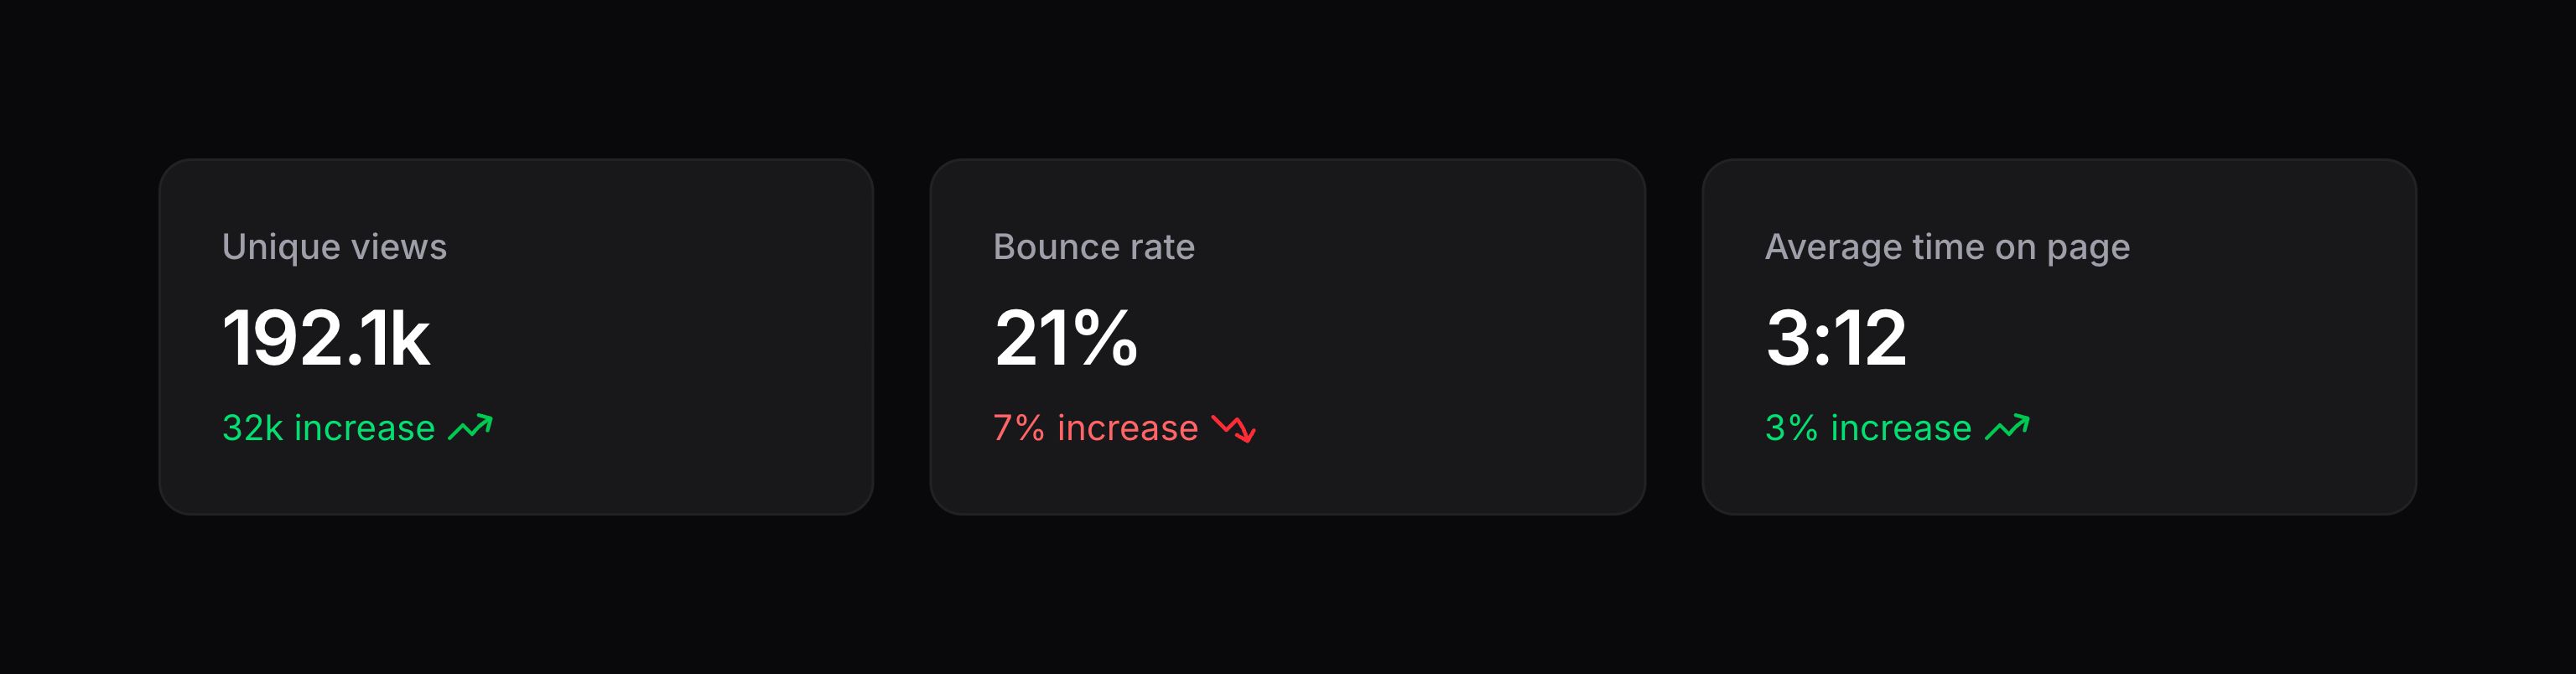
你也可以给状态一个颜色:
use Filament\Widgets\StatsOverviewWidget\Stat;

protected function getStats(): array
{
    return [
        Stat::make('Unique views', '192.1k')
            ->description('32k increase')
            ->descriptionIcon('heroicon-m-arrow-trending-up')
            ->color('success'),
        Stat::make('Bounce rate', '21%')
            ->description('7% increase')
            ->descriptionIcon('heroicon-m-arrow-trending-down')
            ->color('danger'),
        Stat::make('Average time on page', '3:12')
            ->description('3% increase')
            ->descriptionIcon('heroicon-m-arrow-trending-up')
            ->color('success'),
    ];
}
添加额外 HTML 属性到 Stat
使用 extraAttributes() 方法,你可以将额外的 HTML 属性传入 Stat 中:
use Filament\Widgets\StatsOverviewWidget\Stat;

protected function getStats(): array
{
    return [
        Stat::make('Processed', '192.1k')
            ->color('success')
            ->extraAttributes([
                'class' => 'cursor-pointer',
                'wire:click' => "\$dispatch('setStatusFilter', { filter: 'processed' })",
            ]),
        // ...
    ];
}
本例中,我们刻意转义了 $dispatch() 中的 $,因为它不是 PHP 变量,而要将其直接传入到 HTML 中。
Setting a placeholder for a stat
Sometimes a stat’s value may not be available — for example, when a dashboard has nothing to show for a specific period. You can use placeholder() to define what should be displayed instead when the value is blank:
use Filament\Widgets\StatsOverviewWidget\Stat;

Stat::make('Unique views', $uniqueViews)
    ->placeholder('-')
A value is considered blank according to Laravel’s blank() helper. For example, null and empty strings are blank, while 0 and '0' are not.
Setting a default placeholder globally
If you’d like every stat in your app to fall back to the same placeholder by default, you can use the static configureUsing() method in a service provider’s boot() method:
use Filament\Widgets\StatsOverviewWidget\Stat;

Stat::configureUsing(function (Stat $component): void {
    $component->placeholder('-');
});
Individual stats can still override this by calling placeholder() themselves.
添加图表到 Stat
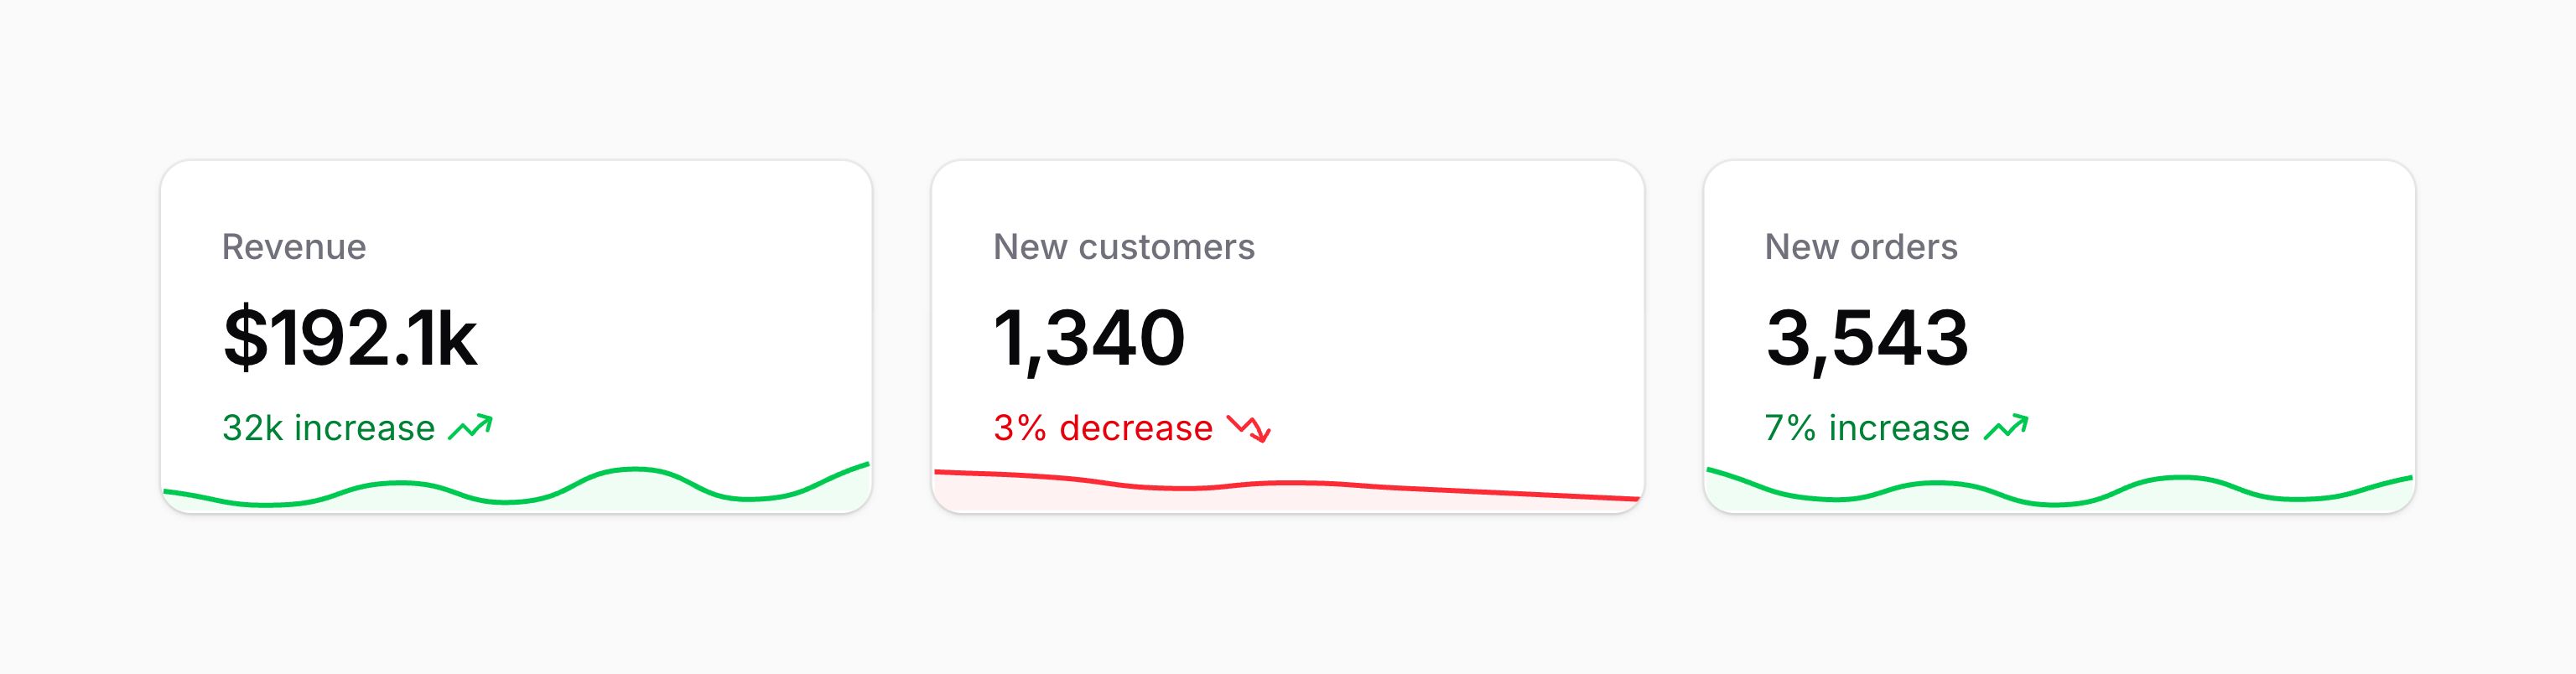
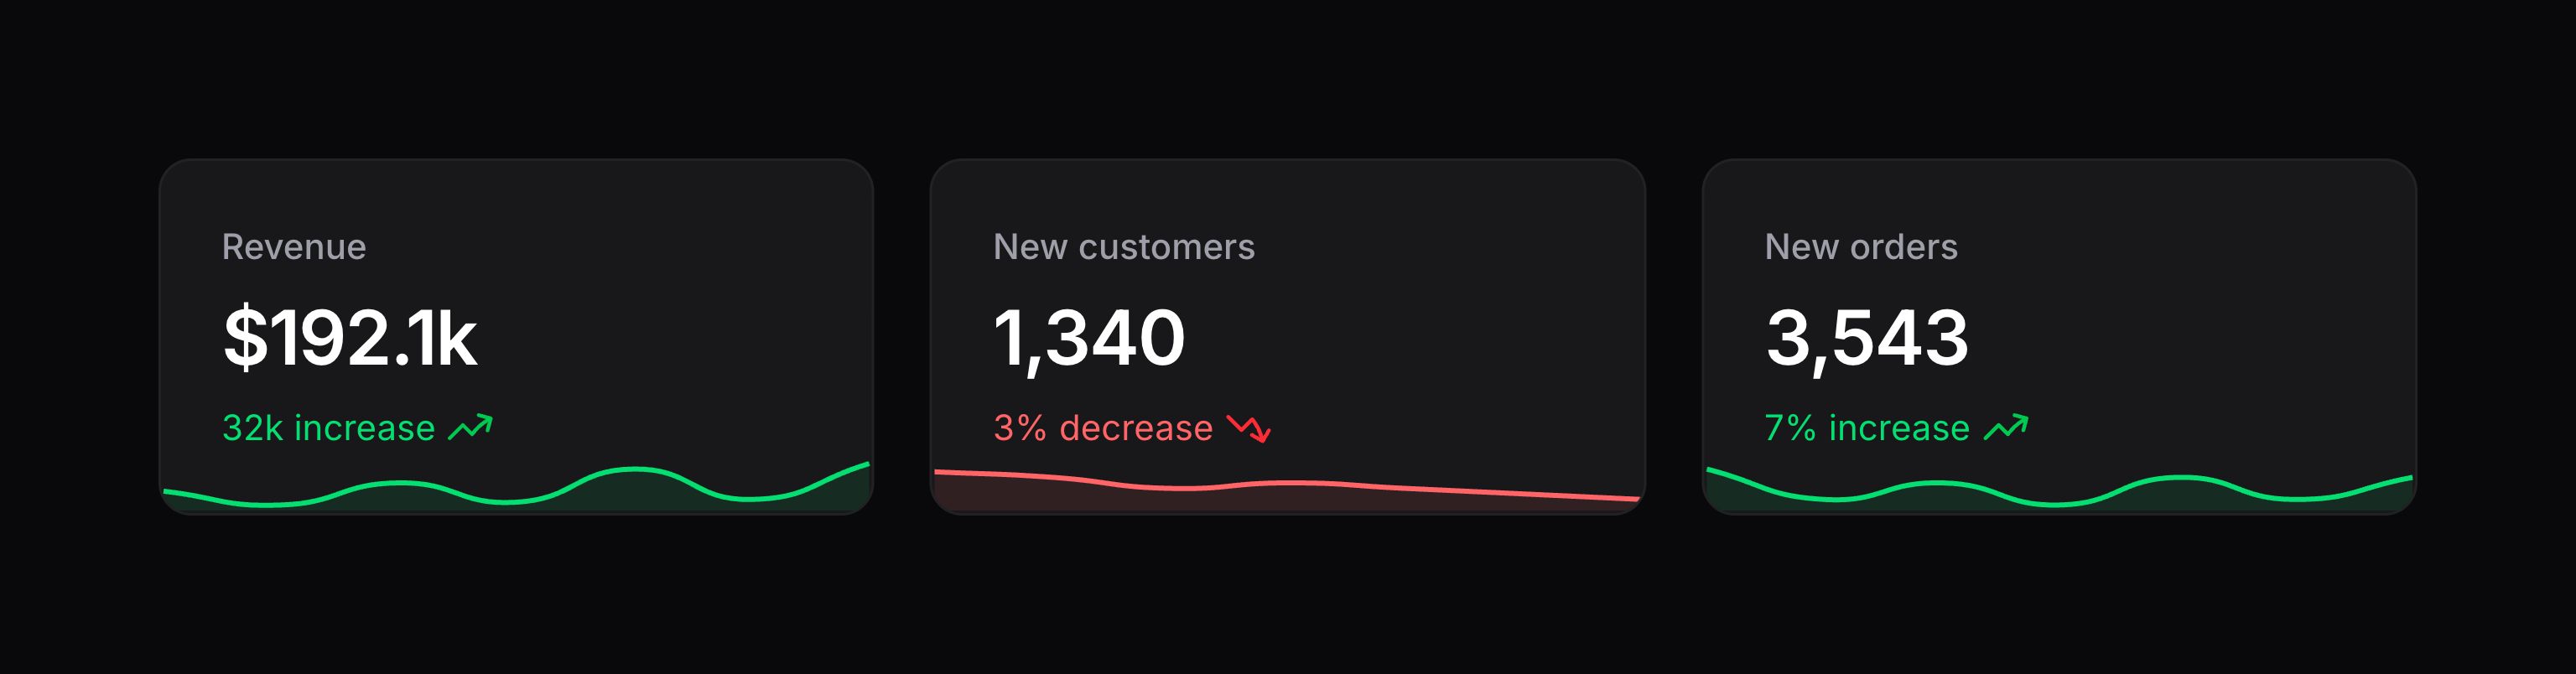
你也可以添加或者链式调用 chart() 到每个 Stat,以提供历史数据。chart() 方法接收一组要绘制的点形成的数组:
use Filament\Widgets\StatsOverviewWidget\Stat;

protected function getStats(): array
{
    return [
        Stat::make('Unique views', '192.1k')
            ->description('32k increase')
            ->descriptionIcon('heroicon-m-arrow-trending-up')
            ->chart([7, 2, 10, 3, 15, 4, 17])
            ->color('success'),
        // ...
    ];
}
Styling stat charts in a theme
Chart.js paints a stat’s chart onto a <canvas>, so its line cannot be reached from a stylesheet. A custom theme is CSS only, so Filament exposes the shape of that line as CSS custom properties, which you may set on .fi-wi-stats-overview-stat, or on any element above it to cover every stat in the panel at once:
.fi-wi-stats-overview-stat {
    --stat-chart-border-width: 1;
    --stat-chart-line-tension: 0;
    --stat-chart-fill: none;
}
--stat-chart-border-width thickens the line, --stat-chart-line-tension curves it, from 0 for straight segments up to 1, and --stat-chart-fill shades the area beneath it, accepting start, end, origin or stack, as well as none to leave the line bare.
These values are handed to Chart.js rather than used by the browser, so they are plain numbers and keywords, without units. If you set one to something Chart.js cannot use, it is ignored and the chart keeps its default. They are also read again whenever the color scheme changes, so you may give light and dark mode different values.
The chart takes its colors from the color of the stat. To change them in a theme, style the .fi-wi-stats-overview-stat-chart-bg-color and .fi-wi-stats-overview-stat-chart-border-color elements with an ordinary color declaration:
.fi-wi-stats-overview-stat {
    & .fi-wi-stats-overview-stat-chart-border-color {
        @apply text-gray-400 dark:text-gray-500;
    }
}
NOTE
These properties only affect the charts inside stats. Chart widgets are styled with their own set, prefixed --chart-.
实时更新统计数据(轮询)
默认情况下,统计概述 Widget 每 5 秒钟刷新一次数据。
你可以通过重写类上的 $pollingInterval 属性自定义间隔时间:
protected ?string $pollingInterval = '10s';
此外,你也可以完全禁用轮询:
protected ?string $pollingInterval = null;
禁用懒加载
默认情况下,Widget 使用懒加载。这意味着只有当它们在页面中可见时才会加载。
要禁用该行为,你可以在 Widget 类中重写 $isLazy 属性:
protected static bool $isLazy = false;
添加标题和描述
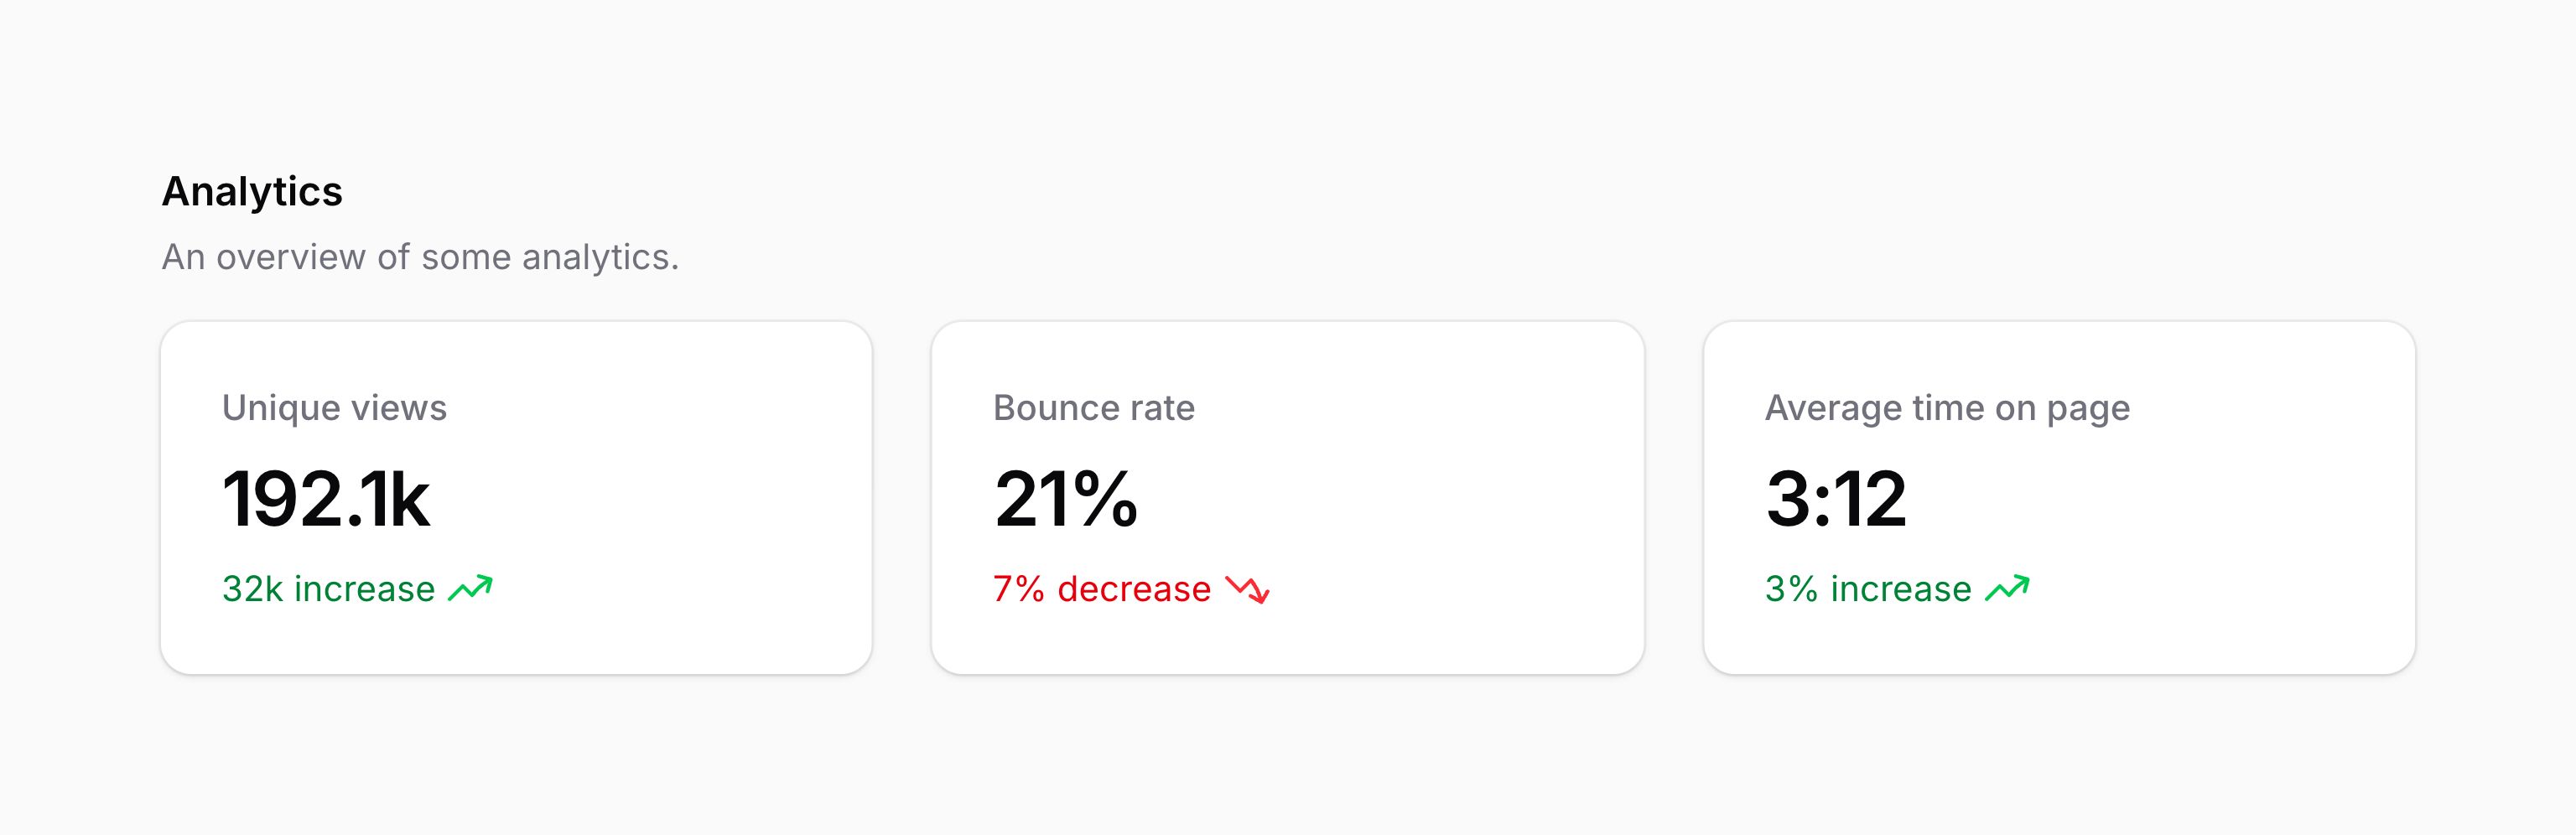
你也可以通过重写 $heading 和 $description 属性在 Widget 上方添加标题和描述文本:
protected ?string $heading = 'Analytics';

protected ?string $description = 'An overview of some analytics.';
如果你需要动态生成标题或描述文本,你可以重写 getHeading() 和 getDescription() 方法:
protected function getHeading(): ?string
{
    return 'Analytics';
}

protected function getDescription(): ?string
{
    return 'An overview of some analytics.';
}
Still need help? Join our Discord community or open a GitHub discussion